Retail analysis - Using TrackLab in a supermarket
Noldus Information Technology teamed up with Jan Linders supermarkets, a chain of supermarkets in the southern part of The Netherlands.
Posted by
Published on
Mon 19 Nov. 2018
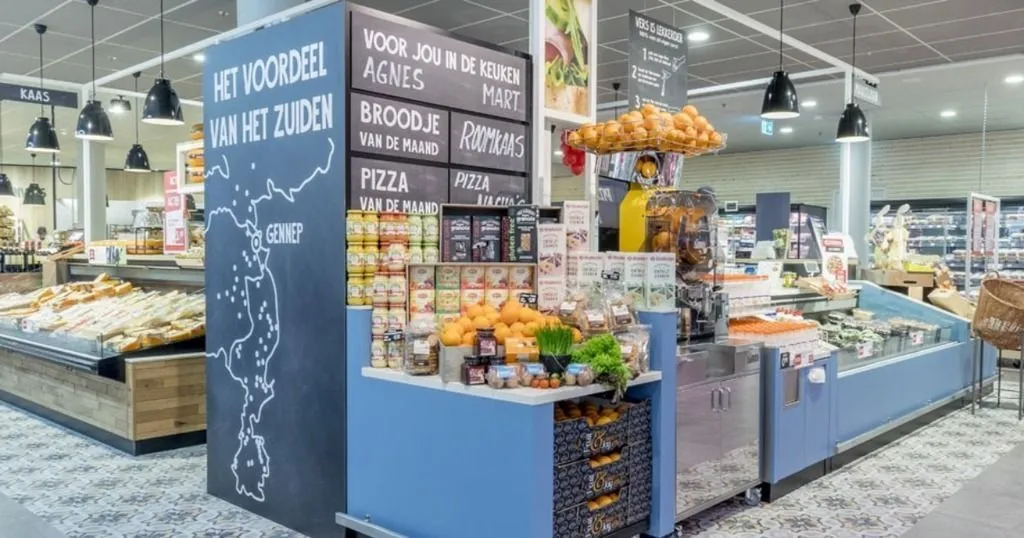
Noldus Information Technology teamed up with Jan Linders supermarkets, a chain of supermarkets in the southern part of The Netherlands. Jan Linders approached us because they wanted to know more about the route their customers are taking when visiting one of their supermarkets.

More specifically their question was:
Do customers predominantly walk the same (common) route and is it possible to change this most commonly followed route by changing the layout of the supermarket and/or the placement of certain products?
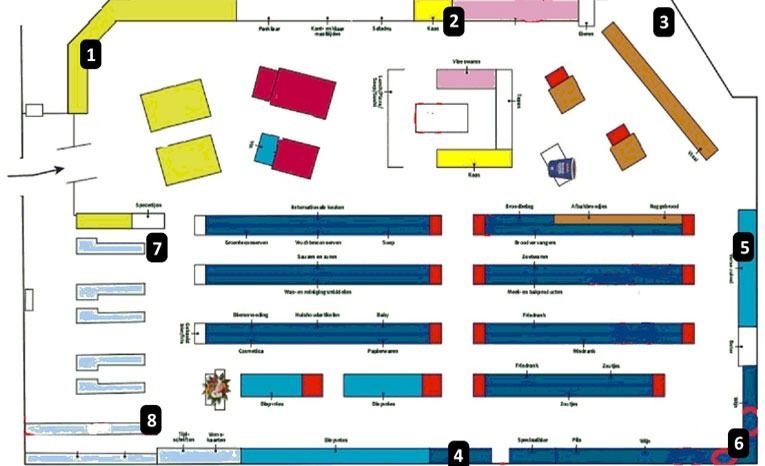
We set out to study this in a specific Jan Linders supermarket that was chosen for its specific layout. First, together with the people from Jan Linders we defined specific areas of interest in the supermarket that would enable us to follow a customer’s route. Next, the TrackLab system was installed with sensors placed at strategic locations to capture the customers’ movement in the areas of interest. The picture below shows a schematic drawing of the supermarket with the position of the 8 sensors.
Retail analysis - Using TrackLab in a supermarket
The movement of customers was tracked with TrackLab during one full week (week 1: Monday - Sunday) in the standard supermarket layout.
Customers were asked to wear a ultra wideband tag on their coat during their normal shopping round through the supermarket. The incentive for participation was a free pack of Dutch “stroopwafels” (syrup waffles). As Dutch people like free stuff, over 2500 customers were willing to have their movement tracked.
We would have liked to combine each customer’s route to the pay desk with the products bought as listed on their receipt, but the professionals at Jan Linders reckoned this would be too much an invasion of privacy.
4500 customers allowed us to track their movements in the supermarket
After week 1 the data were analyzed: for example, average time spent in different areas of interest, percentage of the total number of participants that visited specific areas of interest, route taken in/around specific areas of interest.
Before data acquisition in week 2 started, the layout of the supermarket was changed in/around certain areas of interest, to see if customers would change their route and the time they would spent in the areas of interest. In week 2, around 2000 customers allowed us to track their movements in the supermarket.
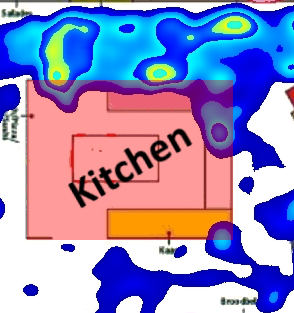
Based on acquiring two full weeks’ worth of data of around 4500 customer, we were able to show the people from Jan Linders not only the most commonly walked routes but also the hot spots (and cold spots) in their supermarket in both weeks. Below is a picture of the heat map around the Jan Linders kitchen that shows that customers mainly pass the kitchen on the left side.
Directing customers to specific areas in the supermarket
Based on this, Jan Linders has already implemented some changes! These changes seem to be successful in directing customers to specific areas in the supermarket, thereby influencing the products they buy. Stay tuned to learn more about how research can help retailers make the best possible store layouts!

Related Posts

In-home video recordings provide measure for more objective comparisons

Creating a custom expression for engagement: a validation study with FaceReader
